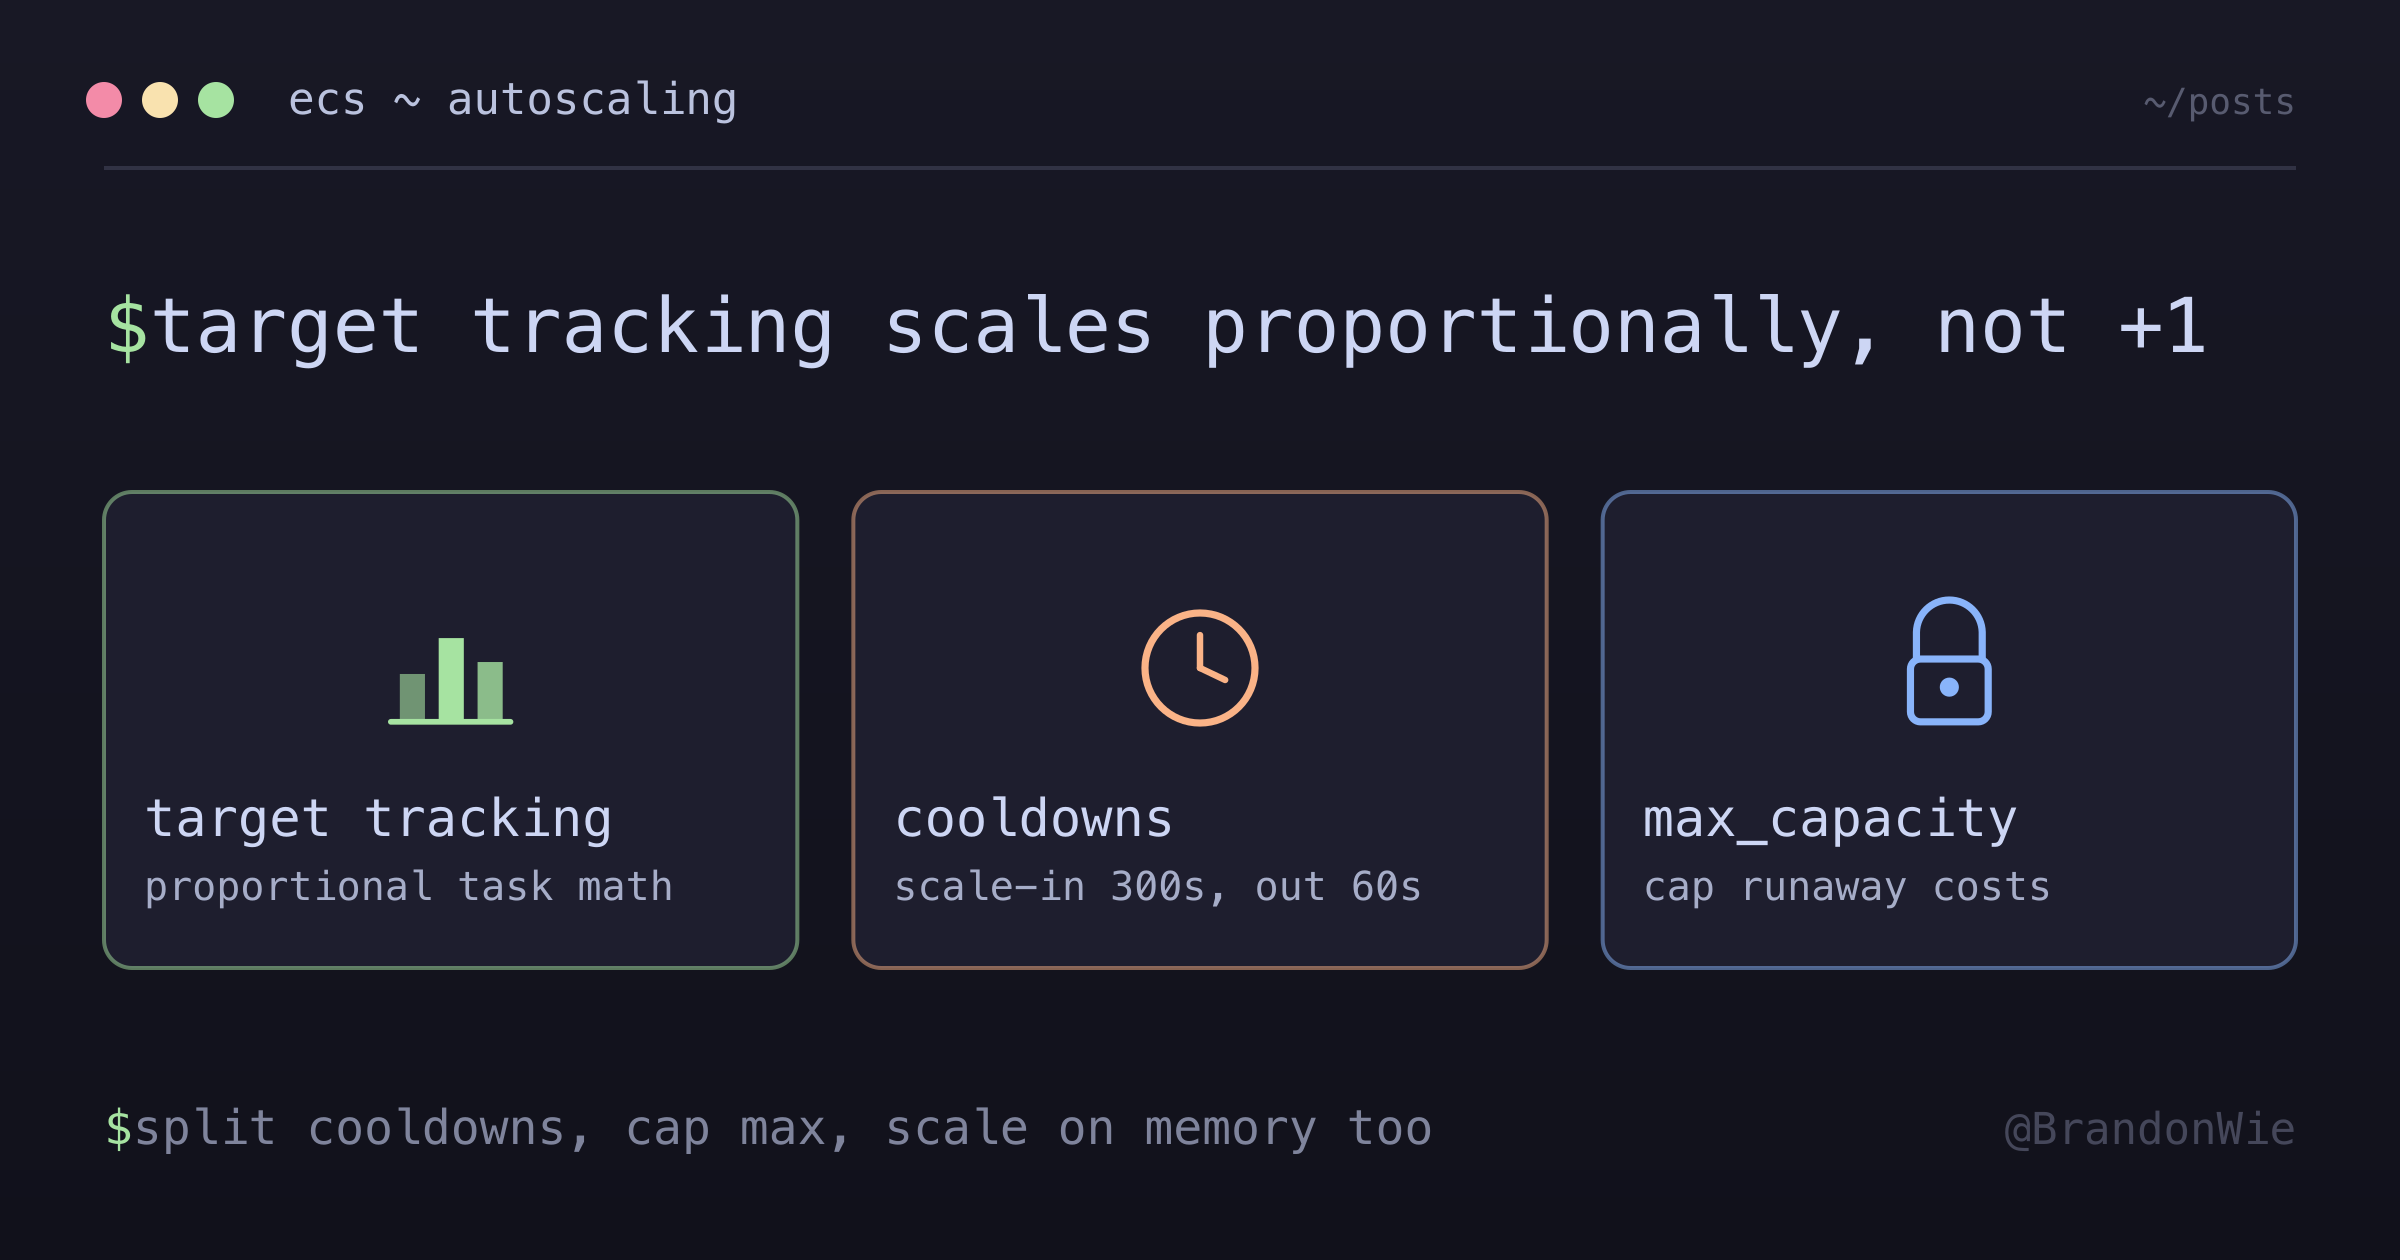
ECS Auto-Scaling Deep Dive
How ECS auto-scaling actually decides task counts: the target tracking algorithm, cooldown asymmetry, and what the numbers cost.
On this page
- The Problem
- Difficulties Encountered
- When to Use
- When NOT to Use
- Container Orchestration Concepts
- What Container Orchestration Does
- ECS vs EKS vs Fargate
- ECS + Fargate Responsibility Model
- Auto-Scaling Types
- Horizontal Scaling (Recommended)
- Vertical Scaling (Not Recommended for Auto-Scaling)
- Target Tracking Scaling Algorithm
- Cooldown Periods
- Why Cooldowns Exist
- Recommended Cooldown Values
- Auto-Scaling vs CloudWatch Alarms
- A Reasonable Starting Point
- Real-World Scenarios
- Scenario 1: Morning Traffic Surge
- Scenario 2: Lunch Peak
- Scenario 3: Evening Wind-Down
- Scenario 4: Memory Leak Detection
- Cost Optimization
- Fargate Pricing
- Monthly Cost Estimates with Auto-Scaling
- Cost Strategies
- Monitoring During Scaling
- Key Metrics to Watch
- CloudWatch Dashboard Setup
- Common Mistakes
- 1. Thresholds Too Low
- 2. Same Cooldowns for Scale-In/Out
- 3. No Max Capacity Limit
- 4. Only CPU Scaling (No Memory)
- 5. Not Testing Scaling Before Production
- 6. Confusing Alarms with Auto-Scaling
- Terraform Implementation
- Resource Structure
- How Terraform Manages State
- Troubleshooting
- Auto-Scaling Not Working
- Rapid Scaling (Flapping)
- High Costs (More Containers Than Expected)
- Decision Tree for Scaling Issues
- Quick Reference
- Recommended Configuration
- Essential Commands
- References
ECS auto-scaling looks like a thermostat and behaves like a proportional controller. This is a walk through the parts I had to get straight before the configuration made sense: the target tracking algorithm, why the two cooldowns should not match, how a scaling policy differs from a CloudWatch alarm, and what the resulting task counts cost.
The Problem
Running containers at a fixed count wastes money during low traffic and drops requests during spikes. ECS auto-scaling solves this, but configuring it correctly requires understanding target tracking algorithms, cooldown periods, the difference between scaling policies and CloudWatch alarms, and how scaling interacts with deployments. Misconfiguration leads to flapping (rapid scale-out/in cycles), runaway costs from unbounded scaling, or unresponsive services that fail to scale when needed.
Difficulties Encountered
- Target tracking is not threshold-based — the initial assumption was “if CPU > 70%, add one container,” but the actual algorithm calculates the proportional number of tasks needed to bring the metric back to target, which can add multiple tasks at once
- Cooldown asymmetry is not obvious — using the same cooldown for scale-in and scale-out causes flapping; scale-in must be much longer (300s+) because removing capacity too quickly leads to immediate scale-out again
- Auto-scaling vs CloudWatch alarms confusion — both reference CPU thresholds but serve completely different purposes; alarms notify humans while scaling policies act automatically, and setting them to the same value defeats the purpose of the alarm as an early warning
- Memory scaling is often forgotten — CPU-only policies miss memory leaks entirely; a Node.js app can OOM-kill at 95% memory while CPU sits at 30%, and no scaling event fires
- Max capacity without context is dangerous — setting
max_capacity = 100as a “safe high number” can exhaust database connection pools or hit API rate limits long before reaching that count
When to Use
- Stateless HTTP services behind a load balancer with variable traffic
- Microservices architecture where individual services have different load profiles
- Production workloads that need automatic recovery from traffic spikes
- Cost optimization for services with predictable daily or weekly traffic patterns (combine with scheduled scaling)
When NOT to Use
- Stateful services with persistent connections — WebSocket servers or long-lived gRPC streams break when tasks are removed; use sticky sessions or connection draining instead
- Services with very slow startup — if your container takes 5+ minutes to become healthy (heavy initialization, large ML model loading), auto-scaling cannot respond to sudden spikes fast enough; pre-warm with scheduled scaling
- Single-task services at minimum — if
min_capacity = max_capacity = 1, auto-scaling adds configuration complexity with zero benefit; just set a fixed desired count - Batch processing workloads — jobs that run to completion do not benefit from target tracking; use ECS scheduled tasks or Step Functions instead
- Development and staging environments — auto-scaling adds unpredictable cost variance; use fixed task counts for non-production to keep billing predictable
Container Orchestration Concepts
What Container Orchestration Does
- Scheduling: Decides where containers run
- Scaling: Adds/removes containers based on demand
- Networking: Ensures containers can communicate
- Health Monitoring: Restarts failed containers
- Load Balancing: Distributes traffic evenly
ECS vs EKS vs Fargate
flowchart TB
    subgraph Orchestrators["Orchestrators (The Brain)"]
        ECS["ECS\nAWS Native\nSimpler, AWS-integrated"]
        EKS["EKS\nKubernetes on AWS\nIndustry standard, portable"]
    end
    subgraph Compute["Compute Engines (The Muscles)"]
        Fargate["Fargate\nServerless\nNo server management"]
        EC2["EC2\nVirtual Machines\nFull control"]
    end
    ECS --> Fargate
    ECS --> EC2
    EKS --> Fargate
EKS --> EC2Clarification: Fargate is NOT Kubernetes. Fargate is serverless compute that works with EITHER ECS or EKS.
- Orchestrator (ECS/EKS) = The brain deciding what to do
- Compute (Fargate/EC2) = The muscles doing the work
ECS + Fargate Responsibility Model
With ECS + Fargate, AWS manages the underlying infrastructure:
flowchart TB
    subgraph You["What You Manage"]
        A["Application Code"]
        B["Docker Container"]
        C["ECS Service Config"]
        E["Running Tasks"]
    end
    subgraph AWS["What AWS Manages"]
        F["Servers"]
        G["OS Updates"]
        H["Docker Daemon"]
        I["Infrastructure"]
    end
    A --> B --> C --> E
    E -.->|"runs on"| F
Auto-Scaling Types
Horizontal Scaling (Recommended)
Adds/removes container instances:
Normal Load:           High Load (Horizontal):
[Container 1 @ 70%]    [Container 1 @ 35%]
[Container 2 @ 35%]- Better for stateless applications
- No downtime during scaling
Vertical Scaling (Not Recommended for Auto-Scaling)
Changes container size:
Normal:                High Load (Vertical):
[2 CPU, 4GB RAM] → [4 CPU, 8GB RAM]- Requires container restart
- Causes downtime
Target Tracking Scaling Algorithm
Target tracking maintains a metric value (like cruise control). The monitoring loop evaluates every 60 seconds and transitions through distinct states:
stateDiagram-v2
    [*] --> Monitoring: Start
    Monitoring --> CheckCPU: Every 60s

    CheckCPU --> ScaleOut: CPU above target
    CheckCPU --> Stable: CPU at target
    CheckCPU --> ScaleIn: CPU below target

    ScaleOut --> AddTask: Add container(s)
    ScaleIn --> RemoveTask: Remove container
    Stable --> Monitoring: No change

    AddTask --> CooldownOut: 60s wait
    RemoveTask --> CooldownIn: 300s wait
    CooldownOut --> Monitoring: Resume
    CooldownIn --> Monitoring: Resume
The algorithm calculates the proportional number of tasks, not just +1/-1:
# Simplified algorithm
current_cpu = get_average_cpu()
target_cpu = 70
current_tasks = get_task_count()

if current_cpu > target_cpu:
    # Calculate needed tasks proportionally
    desired_tasks = current_tasks * (current_cpu / target_cpu)
    desired_tasks = min(desired_tasks, max_capacity)
    if not in_cooldown_period():
scale_to(desired_tasks)Important: It’s NOT a simple “if CPU > 70% add one container”. If 1 task is
at 140% effective load, the algorithm calculates 1 * (140 / 70) = 2 tasks
needed, scaling directly to 2 in one action.
Cooldown Periods
Why Cooldowns Exist
Prevent over-provisioning and flapping:
Without Cooldowns (BAD):
12:00:00 - CPU 75% → Add container
12:00:10 - Still 75% → Add container (new one not ready!)
12:00:20 - Still 75% → Add container
12:01:00 - CPU 20% each → WASTED MONEY
With Cooldowns (GOOD):
12:00:00 - CPU 75% → Add container
12:00:10 - Still 75% → WAIT (cooldown)
12:01:00 - CPU 40% each → Perfect!
Recommended Cooldown Values
| Cooldown | Value | Reasoning |
|---|---|---|
| Scale-Out | 60s | Responsive to load |
| Scale-In | 300s | Prevents flapping |
Auto-Scaling vs CloudWatch Alarms
These serve different purposes:
| Feature | Auto-Scaling Policy | CloudWatch Alarm |
|---|---|---|
| Purpose | Add/remove containers | Send notifications |
| CPU Setting | 70% target | 85% alert threshold |
| Action | Immediate scaling | Human notification |
| Intervention | None needed | May require action |
Why different thresholds?
- 70% target: Auto-scaling maintains this level
- 85% alarm: Warns when auto-scaling might not be enough
A Reasonable Starting Point
These are the values I start from, with the reasoning attached. The “common range” column is convention rather than anything AWS publishes as a required value — treat it as a band to tune inside, not a target to hit.
| Metric | Starting value | Common range | Why |
|---|---|---|---|
| CPU target | 70% | 65-75% | Headroom while a new task becomes healthy |
| Memory target | 80% | 75-85% | Memory drains more slowly than CPU |
| Scale-out cooldown | 60s | 60-120s | Time for one new task to start taking traffic |
| Scale-in cooldown | 300s | 300-600s | Fast removal is what causes flapping |
| Min tasks | 1 | 1-2 | 2 when one task failing must not be an outage |
| Max tasks | 4 (example) | Varies | Derived from downstream limits, not headroom |
About that 4. It is the example ceiling used through the rest of this post
— in the scenarios and the cost table — not a recommendation. The real ceiling
comes from downstream math: task count multiplied by the connections each task
opens has to stay under the database pool limit, and third-party API rate limits
work the same way. The companion post linked from the Terraform section walks
that calculation end to end.
The shape that matters more than any individual number is the asymmetry: scale out fast, scale in slowly. Adding a task early costs a few cents; removing one early costs a scale-out, a cold start, and possibly a latency spike.
Real-World Scenarios
Scenario 1: Morning Traffic Surge
Users arrive at 8:00 AM. CPU climbs gradually, crosses the 70% threshold at 8:45, and auto-scaling adds a task. After the cooldown, load distributes and stabilizes:
| Time | Tasks | Avg CPU | Action |
|---|---|---|---|
| 8:00 | 1 | 45% | Normal morning traffic |
| 8:30 | 1 | 68% | Approaching threshold |
| 8:45 | 1 | 75% | Above 70% — scale out |
| 8:46 | 2 | 40% | Load distributed across 2 |
| 9:00 | 2 | 72% | Above threshold again |
| 9:01 | 3 | 50% | Third task added |
| 9:30 | 3 | 48% | Stable at morning peak level |
Scenario 2: Lunch Peak
A sustained traffic increase that pushes scaling to max capacity:
flowchart TB
    A["11:30 AM\n2 Tasks, 60% CPU"] -->|"Traffic increases"| B["12:00 PM\n2 Tasks, 78% CPU"]
    B -->|"Scale out"| C["12:01 PM\n3 Tasks, 55% CPU"]
    C -->|"More traffic"| D["12:15 PM\n3 Tasks, 74% CPU"]
    D -->|"Scale out"| E["12:16 PM\n4 Tasks, 45% CPU"]
    E -->|"Stable"| F["12:30 PM\n4 Tasks, 65% CPU"]
    A -.- G["Normal load"]
    B -.- H["Above 70% threshold"]
    E -.- K["At max capacity"]
    F -.- L["Handling peak well"]
Key observation: at max capacity (4 tasks) the service handles 65% CPU. If traffic exceeds what 4 tasks can handle, the CloudWatch alarm at 85% fires to notify the team.
Scenario 3: Evening Wind-Down
Scale-in happens conservatively with 300s cooldowns between removals:
| Time | Tasks | Avg CPU | Action |
|---|---|---|---|
| 7:00 PM | 4 | 40% | Below target |
| 7:05 PM | 3 | 52% | Scaled in by 1 |
| 7:10 PM | 3 | 50% | Stable, cooldown active |
| 7:15 PM | 3 | 48% | Still below target |
| 7:20 PM | 2 | 65% | Scaled in again after 5m |
| 8:00 PM | 2 | 45% | Evening stable state |
The 300s scale-in cooldown prevents removing too many tasks at once. Without it, all 3 extra tasks could be removed in seconds, causing a spike.
Scenario 4: Memory Leak Detection
Memory-based scaling catches leaks that CPU-only policies miss entirely. As memory grows linearly over hours, auto-scaling buys time, but the alarm signals a code-level problem:
flowchart LR
    A["10:00\n2 Tasks\n60% Mem"] --> B["11:00\n2 Tasks\n70% Mem"]
    B --> C["12:00\n2 Tasks\n82% Mem"]
    C -->|"Auto-scale"| D["12:01\n3 Tasks\n55% Mem"]
    D --> E["12:30\n3 Tasks\n65% Mem"]
    E --> F["13:00\n3 Tasks\n75% Mem"]
    F --> G["13:30\n3 Tasks\n85% Mem"]
    G -->|"90% ALARM"| H["Alert team\nInvestigate leak"]
Auto-scaling masks the leak temporarily by spreading memory across more tasks, but each task’s memory still grows. The 90% alarm eventually fires, signaling that the application needs a code fix, not more capacity.
Cost Optimization
Fargate Pricing
Per-second billing based on vCPU and memory:
Example: 2 vCPU, 4 GB Memory
- CPU: $0.04048/hour
- Memory: $0.01778/hour
- Total: ~$0.058/hour per task
- Monthly (1 task 24/7): ~$42
Monthly Cost Estimates with Auto-Scaling
Based on 2 vCPU / 4 GB tasks at ~$0.058/hour each:
| Scenario | Avg Tasks | Monthly Cost |
|---|---|---|
| Min (1 task 24/7) | 1 | ~$42 |
| Typical (2 avg) | 2 | ~$84 |
| Peak hours (3 avg) | 3 | ~$126 |
| Max (4 tasks 24/7) | 4 | ~$168 |
Real-world cost is usually between the min and typical range because auto-scaling only runs extra tasks during peak hours, not 24/7.
Cost Strategies
- Right-sizing: Monitor actual usage, reduce if CPU is under 50% consistently — halving vCPU/memory cuts cost by ~50%
- Scaling threshold tuning: 65% target = more containers (higher cost), 75% target = fewer containers (lower cost); 70% is the balanced middle ground
- Scheduled scaling: Reduce min capacity to 0 at night for non-critical services, or use a Gantt-like pattern:
gantt
    title Daily Task Scaling Pattern
    dateFormat HH:mm
    axisFormat %H:%M

    section Tasks
    Night - min 0      :done, night, 00:00, 6h
    Morning ramp       :active, ramp1, 06:00, 2h
    Business hours     :crit, business, 08:00, 10h
    Evening ramp down  :active, ramp2, 18:00, 2h
Night - min 0 :done, night2, 20:00, 4h- Fargate Spot: Up to 70% savings for fault-tolerant workloads that can handle 2-minute interruption notices
Monitoring During Scaling
Key Metrics to Watch
flowchart TB
    subgraph Dashboard["CloudWatch Dashboard"]
        subgraph Perf["Performance Metrics"]
            A["CPU Utilization\ntarget: 70%"]
            B["Memory Usage\ntarget: 80%"]
        end
        subgraph Scale["Scaling Metrics"]
            C["Task Count\nmin to max"]
            D["Scaling Events\nhistory"]
        end
        subgraph Health["Health Metrics"]
            E["HTTP 5xx Rate"]
            F["Response Time\nP50/P95/P99"]
        end
        subgraph Traffic["Traffic Metrics"]
            G["Request Count\nper second"]
            H["Active Connections"]
        end
    end
    A --> I["Auto-Scaling\nDecisions"]
    B --> I
    C --> I
    E --> J["Alerts"]
    F --> J
CloudWatch Dashboard Setup
# View current task count
aws ecs describe-services \
  --cluster my-cluster \
  --services my-service \
  --query 'services[0].runningCount'

# View scaling history
aws application-autoscaling describe-scaling-activities \
  --service-namespace ecs \
  --resource-id service/my-cluster/my-service

# Real-time CPU metrics (last hour, 5-min intervals)
aws cloudwatch get-metric-statistics \
  --namespace AWS/ECS \
  --metric-name CPUUtilization \
  --dimensions Name=ServiceName,Value=my-service \
  --start-time "$(date -u -v-1H +%Y-%m-%dT%H:%M:%SZ)" \
  --end-time "$(date -u +%Y-%m-%dT%H:%M:%SZ)" \
  --period 300 \
  --statistics Average

# Check desired vs running (detect stuck deployments)
aws ecs describe-services \
  --cluster my-cluster \
  --services my-service \
  --query 'services[0].{desired:desiredCount,running:runningCount}'
Common Mistakes
1. Thresholds Too Low
# BAD
target_value = 40.0  # Too aggressive, wastes money

# GOOD
target_value = 70.0  # Balanced
2. Same Cooldowns for Scale-In/Out
# BAD
scale_in_cooldown  = 60
scale_out_cooldown = 60

# GOOD
scale_in_cooldown  = 300  # Conservative
scale_out_cooldown = 60   # Responsive
3. No Max Capacity Limit
# BAD
max_capacity = 100  # Runaway costs possible

# GOOD
max_capacity = 4    # Based on DB connection limits
4. Only CPU Scaling (No Memory)
# BAD - Memory leaks won't trigger scaling

# GOOD - Both metrics
resource "aws_appautoscaling_policy" "cpu" { ... }
resource "aws_appautoscaling_policy" "memory" { ... }
5. Not Testing Scaling Before Production
Always load-test auto-scaling before relying on it:
# Generate load to trigger scaling
ab -n 10000 -c 100 http://your-alb-url/

# Then monitor: did tasks scale? Did they scale back?
aws application-autoscaling describe-scaling-activities \
  --service-namespace ecs --max-results 10
Without testing, you only discover misconfigurations during real incidents.
6. Confusing Alarms with Auto-Scaling
Auto-scaling policies and CloudWatch alarms both reference CPU thresholds but do completely different things:
- Auto-scaling policies = automatically add/remove containers
- CloudWatch alarms = send notifications to humans (SNS, PagerDuty)
Setting them to the same threshold (e.g., both at 70%) means the alarm fires every time scaling happens, creating noise. Keep alarms 10-15% above the scaling target as a “scaling might not be enough” warning.
Terraform Implementation
Resource Structure
ECS auto-scaling in Terraform uses three resource types:
# Step 1: Define scaling limits (the target)
resource "aws_appautoscaling_target" "ecs_target" {
  max_capacity       = 4  # Maximum containers
  min_capacity       = 1  # Minimum containers
  resource_id        = "service/cluster-name/service-name"
  scalable_dimension = "ecs:service:DesiredCount"
  service_namespace  = "ecs"
}

# Step 2: Define scaling policy (the rules)
resource "aws_appautoscaling_policy" "cpu_scaling" {
  name               = "cpu-target-tracking"
  policy_type        = "TargetTrackingScaling"
  resource_id        = aws_appautoscaling_target.ecs_target.resource_id
  scalable_dimension = aws_appautoscaling_target.ecs_target.scalable_dimension
  service_namespace  = aws_appautoscaling_target.ecs_target.service_namespace

  target_tracking_scaling_policy_configuration {
    target_value       = 70.0  # Maintain 70% CPU
    scale_in_cooldown  = 300   # 5 minutes
    scale_out_cooldown = 60    # 1 minute

    predefined_metric_specification {
      predefined_metric_type = "ECSServiceAverageCPUUtilization"
    }
  }
}

# Step 3: Define alarms for monitoring (separate from scaling)
resource "aws_cloudwatch_metric_alarm" "high_cpu" {
  alarm_name          = "ecs-high-cpu"
  comparison_operator = "GreaterThanThreshold"
  evaluation_periods  = 2           # 2 consecutive periods
  metric_name         = "CPUUtilization"
  namespace           = "AWS/ECS"
  period              = 60          # 60-second periods
  statistic           = "Average"
  threshold           = 85          # Alert at 85%
  alarm_actions       = [aws_sns_topic.alerts.arn]
  # This DOESN'T scale - just alerts!
}
How Terraform Manages State
Terraform tracks infrastructure state and only applies the delta:
sequenceDiagram
    participant Code as Your Code
    participant TF as Terraform
    participant State as TF State
    participant AWS as AWS

    Code->>TF: desired_count = 2
    TF->>State: Check current state
    State-->>TF: Current: 0 tasks
    TF->>AWS: Create 2 tasks
    AWS-->>TF: Tasks created
    TF->>State: Update: 2 tasks

    Note over Code,AWS: Later...

    Code->>TF: desired_count = 3
    TF->>State: Check current state
    State-->>TF: Current: 2 tasks
    TF->>AWS: Create 1 more task
    AWS-->>TF: Task created
    TF->>State: Update: 3 tasks
For full Terraform configuration with migration task separation and connection pool math, see ECS Autoscaling Patterns.
Troubleshooting
Auto-Scaling Not Working
# Check IAM permissions
aws iam get-role --role-name ecsAutoscaleRole

# Check service limits
aws service-quotas get-service-quota \
  --service-code fargate \
  --quota-code L-3032A538

# Review scaling activities
aws application-autoscaling describe-scaling-activities \
  --service-namespace ecs \
  --resource-id service/cluster/service
Rapid Scaling (Flapping)
Symptom: Containers constantly adding/removing
Solution: Increase cooldowns
scale_in_cooldown  = 600  # 10 minutes
scale_out_cooldown = 120  # 2 minutes
High Costs (More Containers Than Expected)
# Check actual vs desired task count
aws ecs describe-services \
  --cluster your-cluster \
  --services your-service \
  --query 'services[0].{desired:desiredCount,running:runningCount}'
If running count exceeds what you expect, check whether the scaling target is too low (40% instead of 70%) or whether a memory leak is causing memory-based scaling.
Decision Tree for Scaling Issues
flowchart TD
    A["High CPU Alert?"] -->|"Yes"| B["Check Task Count"]
    A -->|"No"| C["Check Memory"]

    B -->|"At max"| D["Increase max_capacity\nor right-size tasks"]
    B -->|"Not at Max"| E["Check IAM Permissions"]

    C -->|"High >80%"| F["Check for Memory Leaks"]
    C -->|"Normal <80%"| G["System Operating Correctly"]

    E -->|"Missing"| H["Add IAM Policy"]
    E -->|"Present"| I["Check Subnet Capacity\nor Fargate Quota"]

    F -->|"Found"| J["Fix Application Code"]
    F -->|"Not Found"| K["Increase Memory Allocation"]
Quick Reference
Recommended Configuration
Auto-Scaling:
  CPU Target: 70%
  Memory Target: 80%
  Min Tasks: 1-2
  Max Tasks: Based on DB limits
  Scale-Out Cooldown: 60 seconds
  Scale-In Cooldown: 300 seconds

Alarms (Notifications):
  CPU Alert: 85% for 2 minutes
  Memory Alert: 90% for 2 minutes
Essential Commands
# Current task count
aws ecs describe-services \
  --cluster CLUSTER --services SERVICE \
  --query 'services[0].runningCount'

# Scaling history
aws application-autoscaling describe-scaling-activities \
  --service-namespace ecs \
  --resource-id service/CLUSTER/SERVICE

# Current policies
aws application-autoscaling describe-scaling-policies \
  --service-namespace ecs
Comments · github discussions
repo brandonwie/brandonwie.dev · category "Blog Comments" · term ecs-autoscaling-deep-dive