Honest Cross-Language CLI Startup Benchmarks
I expected a Rust rewrite to beat the Node script it replaced by 5-10x. It measured ~1.3x, and the gap taught me more than the win: recover the real baseline, pin the inputs, and attribute the delta before advertising anything.
On this page
When I rewrote the status-line renderer in codex-hud from a Node script to a Rust binary, I already had a number in my head: 5-10x. Rust is compiled, Node has to boot V8, the conclusion felt too obvious to check. Then I checked, and the honest end-to-end figure was about 1.3x.
The gap between what I assumed and what I measured is the interesting part. The rewrite is genuinely better, but not for the reason I was about to advertise, and if I had shipped “5x faster” in a README somebody would have run it and found out. Here is what I did to get a number I would be willing to publish next to a command that reproduces it.
Three ways a rewrite benchmark quietly lies
All three are easy to walk into while feeling rigorous about it.
No baseline. The old implementation was deleted at rewrite time. There is nothing in the working tree to A/B against, which makes “just assume the new one is faster” the path of least resistance. An assumption dressed up as a benchmark carries the authority of a number without any of the evidence.
Unfair inputs. Two binaries that read config and environment differently will happily run in the same benchmark loop and do different amounts of work. The stopwatch does not care. You get a ratio, it looks precise, and it compares apples to oranges.
Attribution error. A short-lived CLI spends much of its wall time on shared I/O (spawning git, reading log files) that is identical in both implementations. Crediting the whole delta to “the new language is fast” is the claim most likely to fall apart the moment a reader profiles it themselves.
Getting the baseline back
The old renderer was gone from the tree but not from history, which leaves three options with very different costs.
| Option | What you get | What it costs |
|---|---|---|
| Assume the rewrite is faster | A number, instantly | It is worth nothing, and a reader can disprove it in one command |
| Restore the old file into the repo | A real A/B | A stale second implementation someone has to remember to delete |
| Extract it from history at runtime | A real A/B, nothing to clean up | Needs the history to be present (a shallow clone has none) |
I went with the third. The benchmark script pulls the old implementation out of the commit before its removal and writes it to a temp dir, so nothing stale ever lands in the repo:
// LEGACY_REF = "<removal-commit>^"  (parent of the "remove legacy X" commit)
const src = execFileSync("git", ["show", `${LEGACY_REF}:${LEGACY_PATH}`], {
  encoding: "utf8"
});
fs.writeFileSync(path.join(tmpDir, "legacy.js"), src);
Finding the right ref is the only fiddly part. git log --diff-filter=D --oneline -- <path> lists the commits that deleted that path; the parent of the deletion commit (^) is the last commit that still had the file, which is exactly what git show <ref>:<path> needs. Making the recovery best-effort matters too. If history is unavailable, the script falls back to measuring the new implementation alone rather than failing outright, so it stays runnable in CI checkouts.
The useful part is the habit. The old implementation is usually one git show away, so “the previous version is gone” is rarely a real reason to skip the comparison.
Pinning the inputs is what makes it a comparison
With a baseline in hand, the next question is whether both binaries are doing the same work. In this case they were not, reliably.
The renderer resolves config from four layered sources: an environment variable, a project-level file found by walking up from the current directory, a home-directory file, then built-in defaults. That is a reasonable design for a tool humans invoke from anywhere, and it breaks a benchmark, because the output depends on where you ran it from. Pinning the highest-precedence source removes the ambiguity:
const env = { ...process.env, CODEX_HUD_CONFIG: pinnedConfigPath };Then the script asserts parity instead of assuming it: run both binaries, diff stdout, and only call the comparison fair when they match byte for byte under the pinned inputs.
This was not a theoretical precaution. Byte-identical output was true in one shell and false in another. Same two binaries, different working directory, a different codex-hud.toml resolved, and one field rendering xh in one run and xhigh in the other. That reads like a formatting bug in the renderer, and it was not one: the mismatch was a config-resolution artifact, and it disappeared once the config was pinned, at 10 runs out of 10 identical.
Parity depends on the harness as much as on the binaries. If you cannot reproduce identical output on demand, you do not yet know what your benchmark is measuring.
Attributing the delta instead of aggregating it
The last trap is the one that changed the story. Rather than timing one command and reporting the ratio, the script measures two paths per binary:
- a no-work path (
--helpor--version), which isolates process spawn plus language-runtime startup; - the full hot path, the real command, which is startup plus the shared I/O both implementations do identically.
Here is roughly what came back on my machine:
| Path | Node | Rust | Delta |
|---|---|---|---|
--help (startup only) | ~22 ms | ~1.5 ms | ~20 ms |
Full paint (startup + git + log parsing) | n/a | n/a | ~20 ms |
| Shared work inside the full paint | ~54 ms | ~54 ms | ~0 |
The test is whether (node_help - rust_help) is approximately (node_full - rust_full). When those two deltas agree, the per-invocation win is runtime startup, because the shared work is a constant that both implementations pay in full. That is why the end-to-end figure was only ~1.34x: about 54 ms of git invocation and log parsing sits on both sides of the comparison and dilutes a real 20 ms advantage.
Once decomposed, “Rust is 1.3x faster” and “Rust skips Node’s ~20 ms cold start on every paint” describe the same measurement. The second one is the defensible version, and it is also the one that tells a reader what will happen in their environment.
The harness was distorting the ratio too
There is one more distortion, and it comes from the measuring apparatus rather than the code under test. Timing each binary with spawnSync from a parent Node process adds a roughly constant overhead C to both measurements, so what gets reported is (node + C) / (rust + C), a ratio pulled toward 1.0. The measured ratio is understated, not inflated, which is a comfortable direction to be wrong in but still wrong.
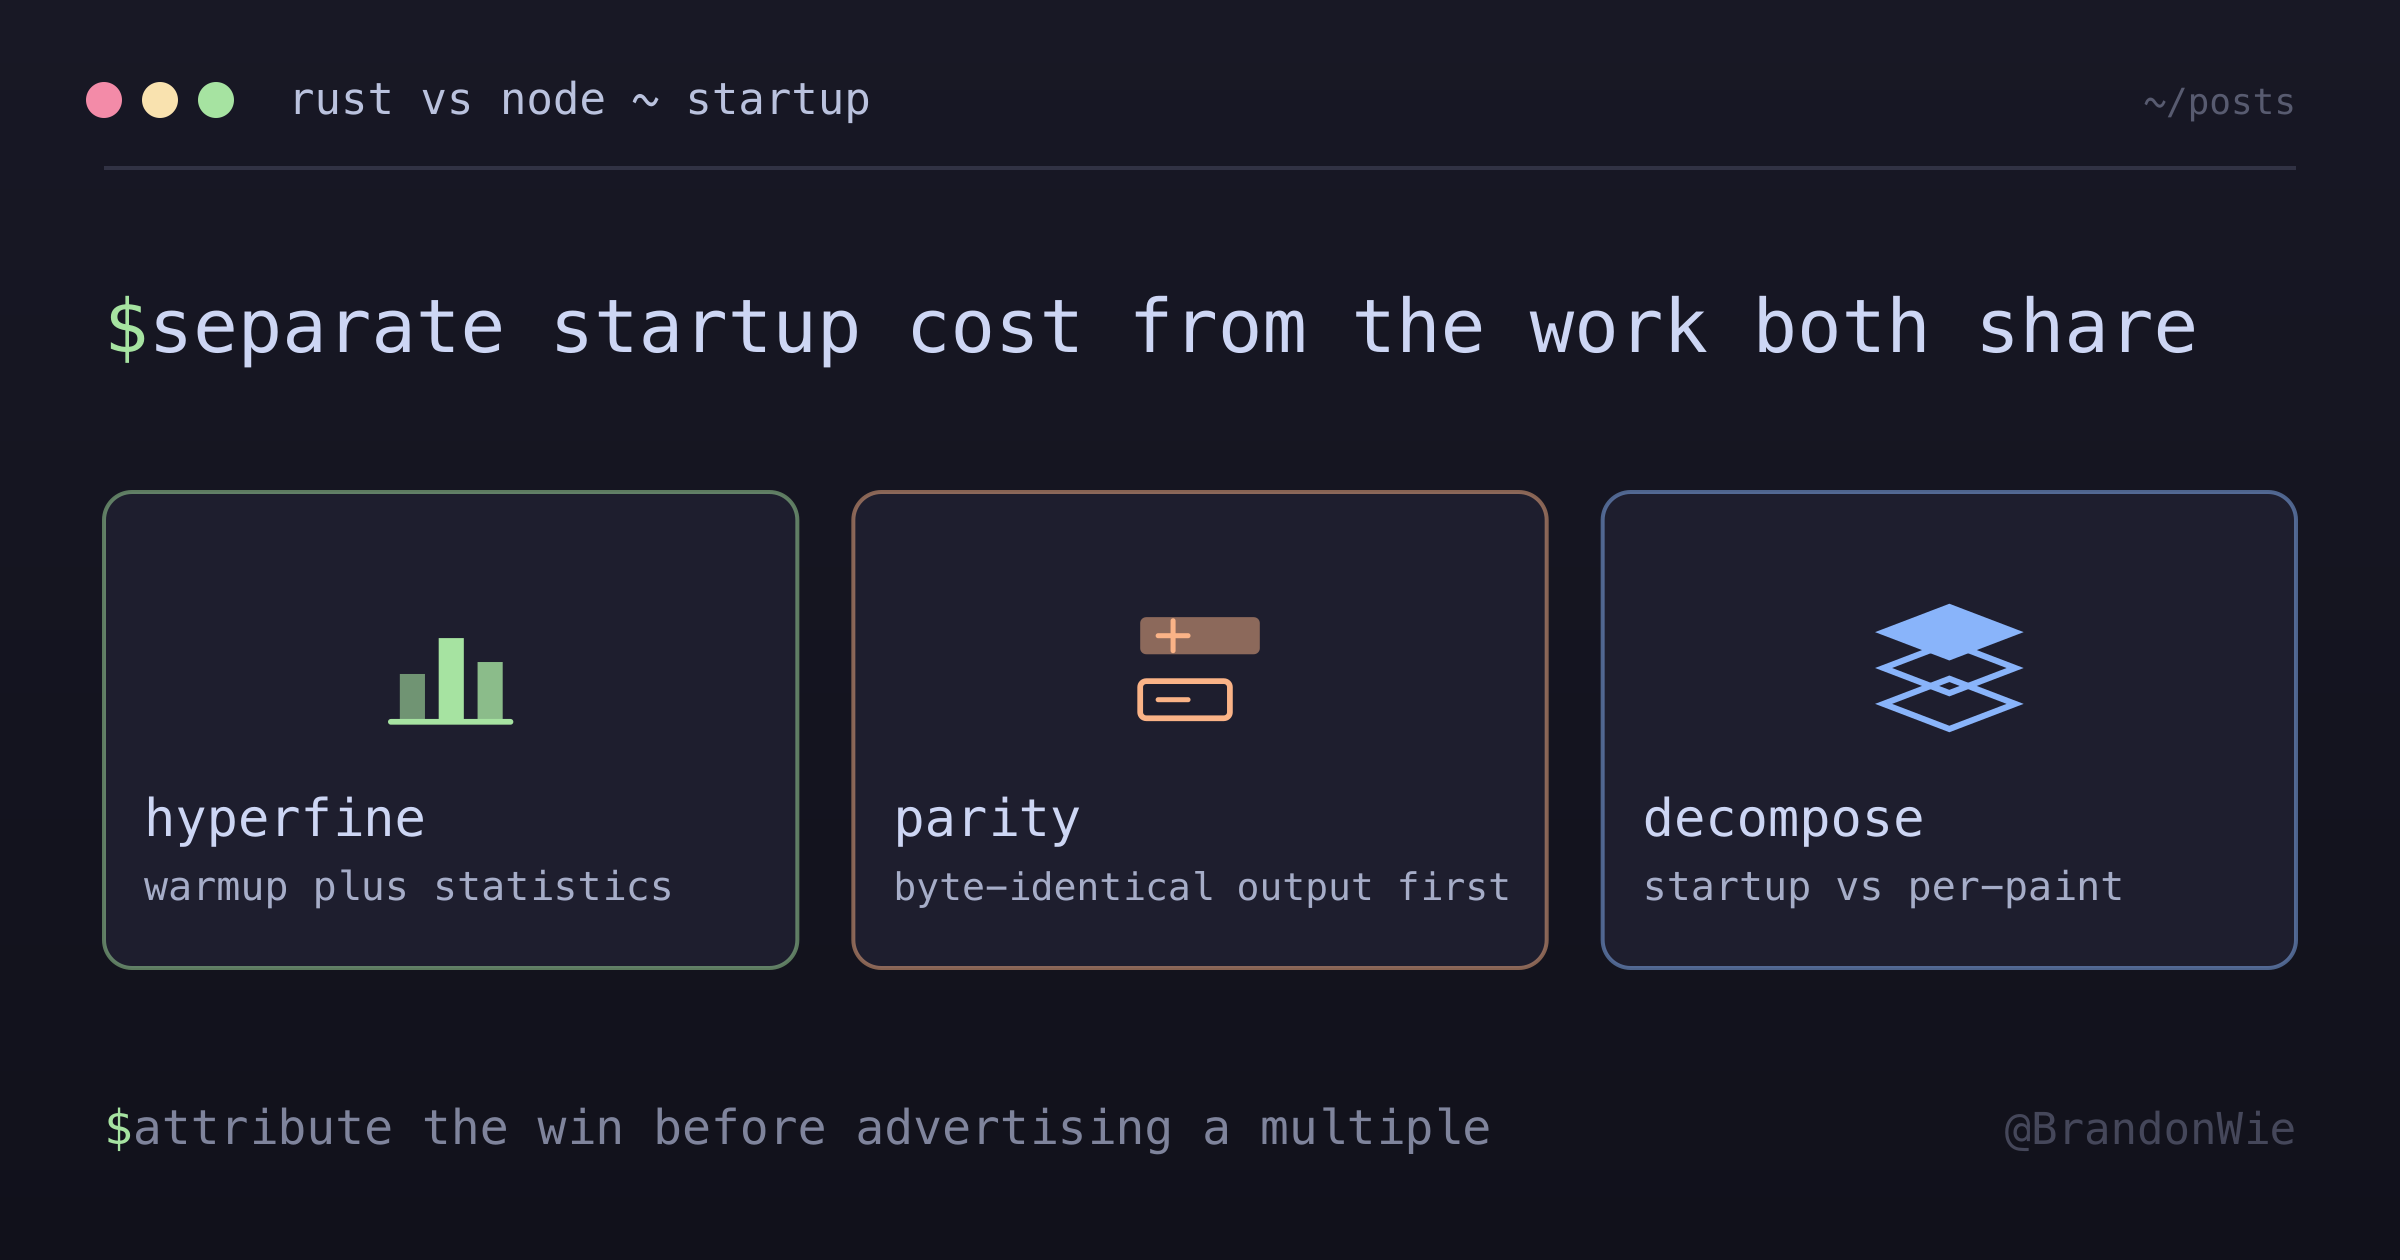
The difference in delta survives the harness; the ratio does not. That is a good argument for reporting deltas, and a better argument for timing binaries directly via exec, or handing the job to a purpose-built tool like hyperfine, which handles warmup runs and statistical outlier detection rather than leaving you to eyeball a handful of numbers.
Ratios turned out to be unstable for a second reason as well. As session logs grew during one sitting, the full-paint figure moved from 1.34x to 1.49x on the same binaries and the same machine, with more data to parse. The startup delta did not move at all. A number that drifts with the state of your working directory is not a number to put in a README.
What I published instead of a multiple
The conclusions that survived all of this are narrower than the pitch I started with.
I published the conservative figure with a reproduction caption, something in the shape of “indicative, single machine, median of N runs, reproduce with <cmd>”, so that a reader who runs it sees an equal-or-better result, never a worse one. Advertising the lower bound means the benchmark can only surprise people pleasantly.
The benchmark itself shipped as a re-runnable script rather than a one-off session. That keeps the published number honest as the code changes, and it lets a skeptical reader check the claim without taking my word for the methodology.
And the headline changed. The pitch stopped being a speed multiple and became the thing the measurement actually supports: the native binary skips Node’s ~20 ms cold start on every paint, and ships as a single ~574 KB binary with no runtime dependency. The architecture claim was always the stronger one, and the inflated number was hiding it.
When this is worth the trouble
This much ceremony fits a narrow set of situations: advertising a rewrite’s performance where the claim has to survive public scrutiny, answering “is the new version actually faster?” when the old version still lives in git history, and short-lived CLIs, hooks, or status-line renderers where process startup is a meaningful fraction of total wall time.
It fits badly elsewhere. For long-running services, startup is noise, and steady-state throughput and p99 latency are the numbers that mean something. For genuinely non-deterministic workloads where inputs cannot be pinned, the fairness fix is unavailable, so report distributions rather than a single ratio. And when the honest delta turns out to be too small to matter, the right move is to stop leading with speed: talk about the architecture (one native binary, no runtime dependency) and let performance be a supporting detail.
Practical takeaway
The discipline that produced a claim I trust is three steps, none of them clever: recover the real baseline instead of assuming, pin the inputs until output is byte-identical, and decompose startup from shared work so the language only gets credit for the part that is actually the language. What I got wrong was starting with a number I wanted and looking for a measurement to support it. Measuring first gave me a smaller number and a better story.
References
- hyperfine: command-line benchmarking with warmup runs and statistical outlier detection, which is what you want instead of a hand-rolled timing harness
git log:--diff-filter=Dselects the commits that deleted a path, the first step in locating a removed baselinegit show: prints a blob at a given revision, which is how the old implementation comes back without touching the working treechild_process:execFileSyncandspawnSync, including the synchronous-spawn behavior that adds constant overhead to a Node-hosted timing harness
Comments · github discussions
repo brandonwie/brandonwie.dev · category "Blog Comments" · term cross-language-cli-startup-benchmark