Prometheus TSDB memory sizing — why observability services need different budgets
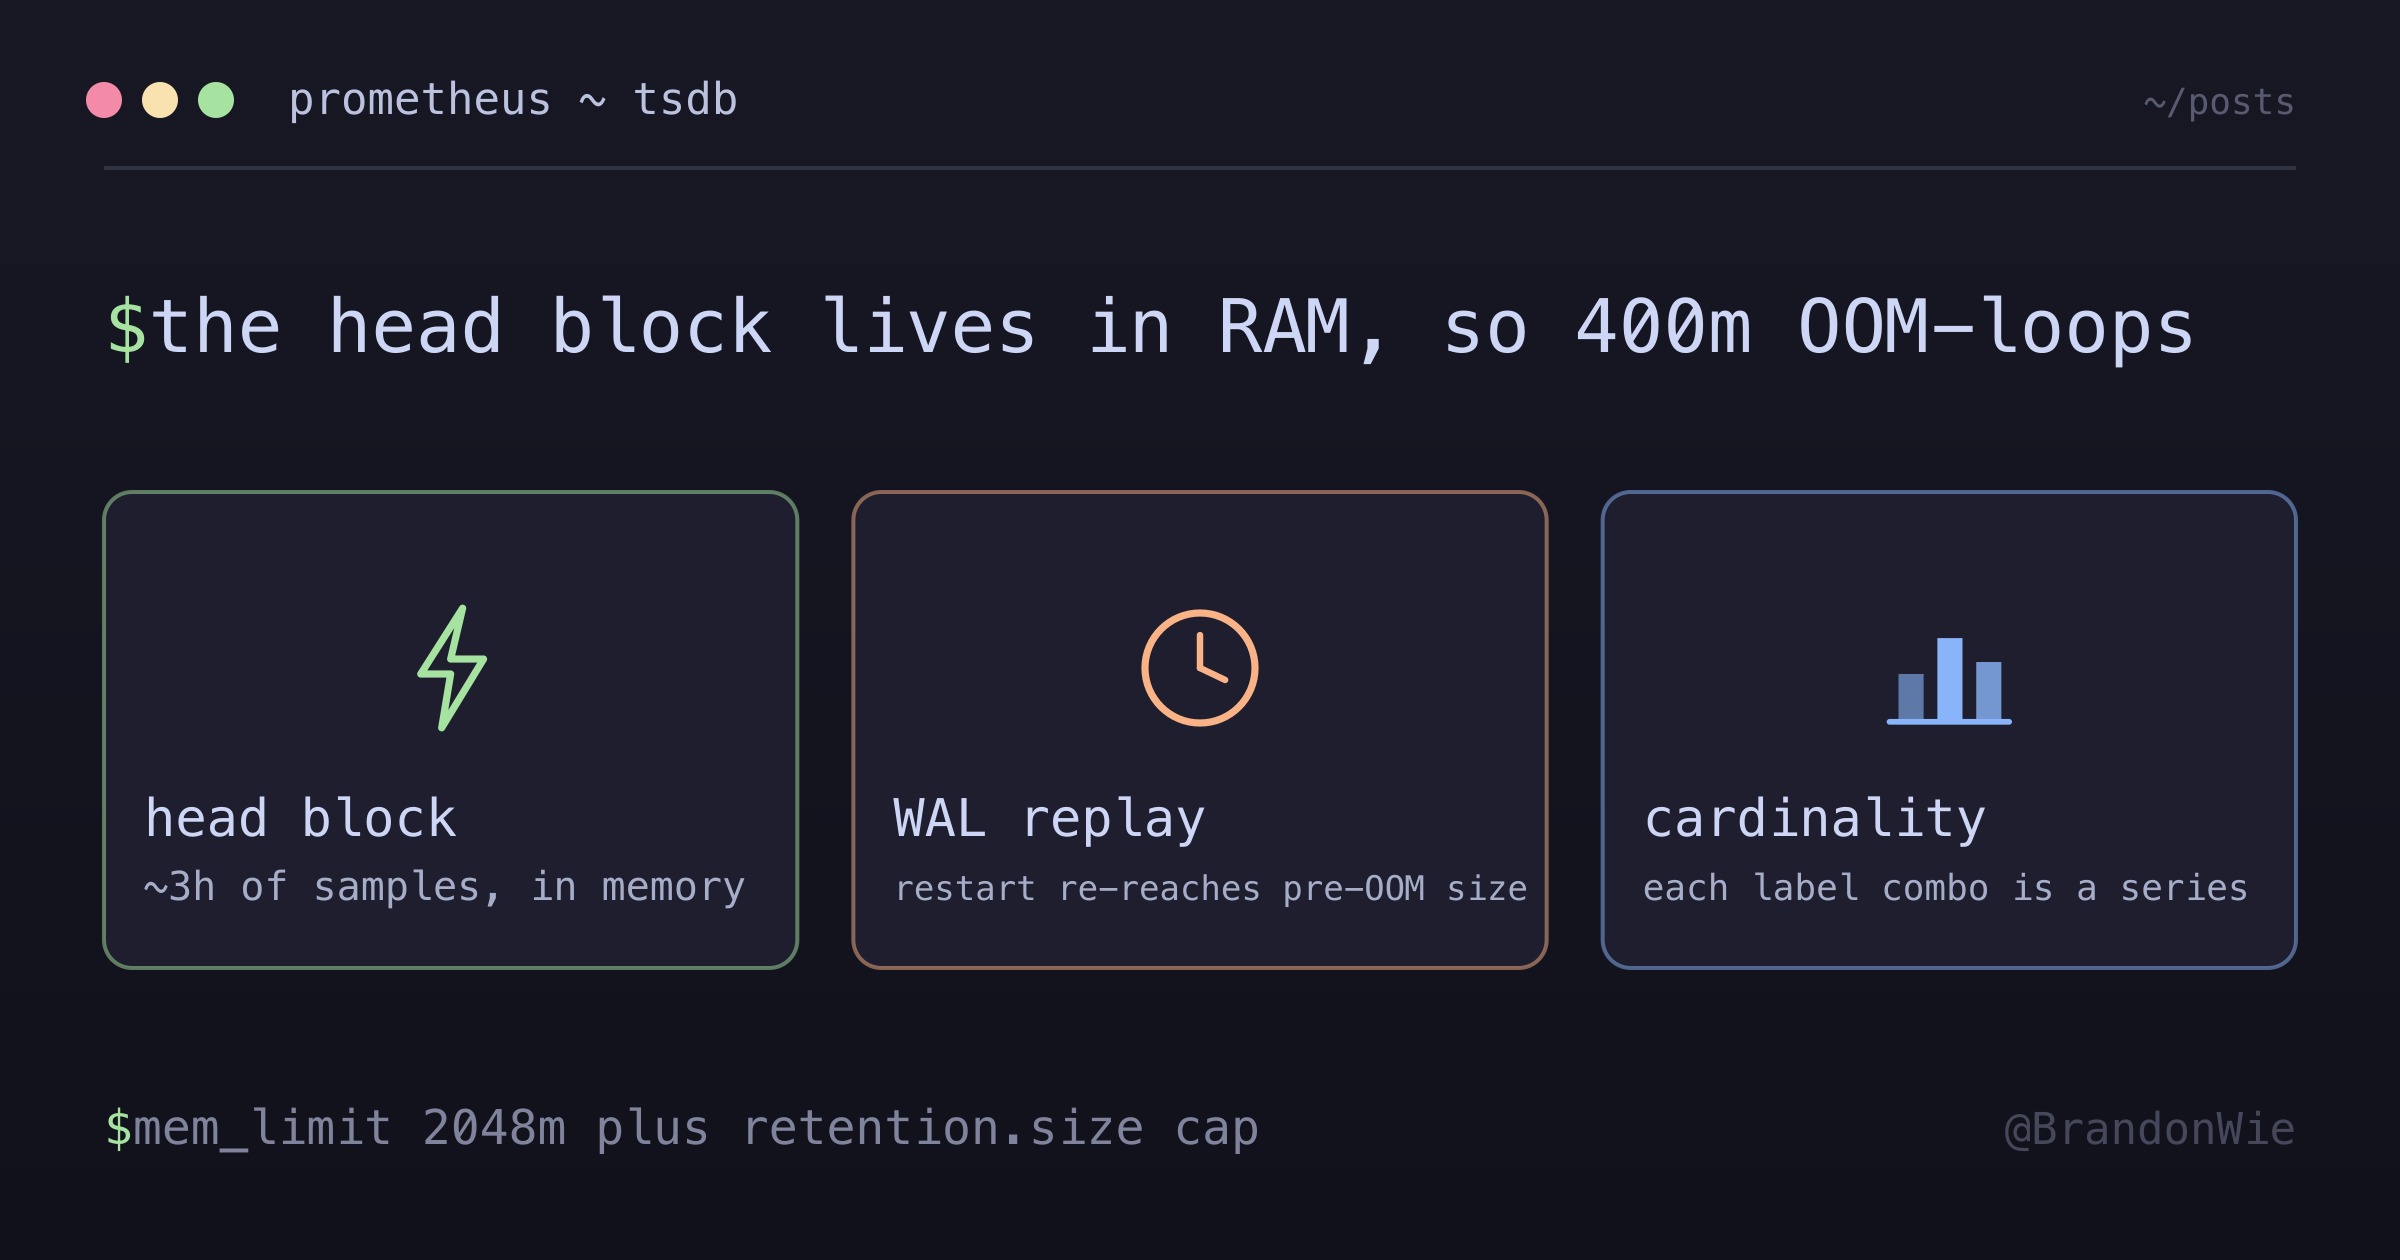
I set memory limits across an LGTM stack by analogy and gave Prometheus 400m. Prometheus keeps its head block in RAM, so that number bought an OOM-restart loop that looked like flapping.
On this page
When I set up the observability stack for crucio, my own side project, I picked the memory limits in the Compose file by analogy. Grafana had been content at 200m. Loki and Tempo were fine at 300m each. Prometheus felt like the heavier one, so it got a bit more:
grafana:    mem_limit: 200m
loki:       mem_limit: 300m
tempo:      mem_limit: 300m
prometheus: mem_limit: 400m  # ← the bug
That last line is the whole post. Prometheus at 400m will OOM under any realistic scrape load, and because the container carried restart: unless-stopped, the failure showed up as flapping rather than as a crash: a service that was up, then briefly not, then up again, with no single moment that looked like an incident.
The four services do not have the same memory shape
The framing that produced 400m was “four Go binaries, each reading a config file, each doing roughly the same amount of work.” Under that model, giving Prometheus 33% more than Loki reads as generous. The model is wrong, and this is the part that surprised me most when I went looking:
| Service | Memory shape | Typical baseline |
|---|---|---|
| Grafana | Stateless UI | 100-200 MB |
| Loki | Streaming log backend (writes to disk) | 200-400 MB |
| Tempo | Streaming trace backend (writes to disk) | 200-400 MB |
| Prometheus | In-memory TSDB head block + WAL (3h samples) | 500 MB - 1.5 GB |
Grafana renders dashboards and queries other people’s data, so it holds close to nothing. Loki and Tempo are write paths: data arrives, gets buffered briefly, and goes to disk. Their memory use scales with throughput, and throughput on a small stack is small.
Prometheus is different in kind. It is a database whose active working set lives in RAM, and the storage docs say so directly: “The current block for incoming samples is kept in memory and is not fully persisted. It is secured against crashes by a write-ahead log (WAL) that can be replayed when the Prometheus server restarts.”
That in-memory block is the head block, the TSDB’s newest and still-mutating chunk of time series data. Its practical size falls out of another line in the same docs, in the backfilling section: “it is not safe to backfill data from the last 3 hours (the current head block)“. Roughly three hours of samples, for every series you scrape, resident the entire time. The WAL buffer sits on top of that, written out in 128MB segments.
For about ten scrape targets at a 15-second interval with ordinary cardinality, the resident baseline I would now plan for is 500 MB to 1.5 GB. So 400m sat below the floor from the first scrape, rather than being a tight budget that occasionally spilled.
The restart policy is what kept it quiet
An under-provisioned Prometheus would have been a five-minute diagnosis if it had stayed dead. restart: unless-stopped is what turned a capacity bug into a visibility bug:
1. Prometheus running near cap (~400 MB)
2. Load spike (new scrape target, cardinality bump, query evaluation)
3. Head block grows past 400 MB
4. Docker cgroup OOM kills Prometheus
5. Docker restarts Prometheus (unless-stopped policy)
6. Prometheus loads WAL on startup → immediately reaches pre-OOM memory
7. Docker OOM kills Prometheus again
8. → INFINITE LOOP
Step 6 is the part that makes this self-sustaining rather than self-correcting. A fresh Prometheus with an empty head block would fit inside 400m for a while. A restarting Prometheus does not get that grace: it replays the WAL, rebuilds the head block it just died holding, and arrives back at its pre-OOM footprint within seconds of starting.
Docker has a guard against restart loops, and it does not help here. The restart-policy docs note that a policy only takes effect once a container has started successfully, defined as being up for at least ten seconds, which “prevents a container which doesn’t start at all from going into a restart loop.” Prometheus does start. It comes up cleanly and then dies on the far side of that ten-second threshold, once WAL replay has refilled the head block, so every cycle counts as a legitimate restart.
The practical consequence is that docker ps lies. Snapshot it at the wrong moment and the container reads healthy, because it really is running most of the time. The two signals that were actually telling the truth were WAL replay messages in docker logs on every start, and scrape gaps visible in Grafana. The second one is the ironic part, since the service whose job is to notice outages was the one having them.
What tipped it over was cardinality, not traffic
If a baseline sits comfortably under the cap, what pushes it over? Sizing web services had trained me to look at request volume, which turns out to be the wrong variable here. What matters is anything that creates new time series:
- A service emitting metrics with high-cardinality labels such as per-user, per-URL, or per-record-id
- A new scrape target being added to the config
- A query over a long retention window that materializes many series in memory
- A batch of duration histograms landing, where every bucket of every histogram is a separate series
The last one is what did it in my case. Link-note processing in crucio’s worker emitted Celery task-duration histograms, and a histogram costs one series per bucket plus a sum and a count. New task labels meant new histograms meant a step change in series count, which is why the failure was deterministic rather than random: it tipped past 400m whenever a link note arrived.
Prometheus’s own instrumentation guidance puts the cost plainly: “Each labelset is an additional time series that has RAM, CPU, disk, and network costs.” The same page suggests keeping the cardinality of a metric below 10, and treating anything with the potential to exceed 100 as a design problem rather than a tuning problem. I had read that advice as being about large fleets. It applies just as well to one worker on a NAS, because the resource it spends is the same resource the head block needs.
The knobs, and which two I turned
There are more ways out of this than “raise the number,” and they trade off against different things:
| Option | What it costs |
|---|---|
Raise mem_limit | Host RAM, taken from other containers on the same box |
| Increase the scrape interval | Resolution: 15s to 60s loses detail on short-lived spikes |
| Drop scrape targets | Coverage, which is the thing the stack exists to provide |
Shorten --storage.tsdb.retention.time | History for after-the-fact debugging |
Cap --storage.tsdb.retention.size | Nothing much, until it starts silently dropping old blocks |
| Remove high-cardinality labels | Nothing, if the labels were not being queried anyway |
Cutting resolution or targets was the wrong trade for me. On a small personal stack the point of the metrics is to catch the rare event, and both options work by seeing less. Shortening retention would have helped disk more than RAM, since the head block is governed by how many series are live right now, not by how long old blocks are kept.
So I turned the two that cost the least: raise the limit, and bound the TSDB by size. Fixing the label hygiene at the source was the honest third option, and I did not do it in that change, because the histograms were useful and I wanted the stack stable before touching instrumentation. That ordering is a preference, not a rule; someone with a fixed RAM budget would reasonably do it the other way around.
The fix
prometheus:
  image: prom/prometheus:v2.54.1
  command:
    - --config.file=/etc/prometheus/prometheus.yml
    - --storage.tsdb.path=/prometheus
    - --storage.tsdb.retention.time=7d
    - --storage.tsdb.retention.size=1GB # ← ADDED
    # ... other args
  mem_limit: 2048m # ← RAISED from 400m
mem_limit: 2048m is the same knob as docker run --memory, and it is what the cgroup OOM killer enforces. The number gives the head block room at steady state and, more importantly, leaves headroom for WAL replay on restart so a single OOM does not immediately become a second one.
Two things about that 2048 are worth being straight about. First, I originally wrote in my notes that it “matches the Prometheus docs’ production floor.” Going back to check while writing this post, I could not find a published RAM minimum in the Prometheus documentation. What the docs give is disk sizing: an average of 1-2 bytes per sample, and the formula needed_disk_space = retention_time_seconds * ingested_samples_per_second * bytes_per_sample. There is no equivalent memory formula on that page. So 2 GB was a headroom choice informed by observed baselines, not a documented requirement, and I had filed it in my head as more authoritative than it was.
Second, --storage.tsdb.retention.size=1GB does less than I originally credited it with. I filed it as a belt-and-suspenders guard against runaway head growth. The docs are specific that it is not: “Only the persistent blocks are deleted to honor this retention although WAL and m-mapped chunks are counted in the total size.” It bounds disk, and it bounds how much a cardinality explosion can accumulate on disk over time. It does not cap the head block in RAM. I still set it, but I no longer treat it as a memory safeguard.
Docker’s own resource-constraints docs give the advice that would have saved the whole detour: “Perform tests to understand the memory requirements of your application before placing it into production.” Copying a neighbor’s limit is the opposite of that, and it is exactly what I did.
What I would carry forward
Uniform memory limits across an observability stack are a smell. Four services sitting at 200m/300m/300m/400m looks tidy in a diff and encodes a claim that is not true, that these processes have comparable memory architectures. When I set a limit now I try to leave a comment saying why that number and not another one, because the next person reading the file, usually me months later, otherwise inherits the analogy rather than the reasoning.
restart: unless-stopped is genuinely useful and it does hide capacity problems. Without it, an OOM would have been loud: a dead container, a gap in dashboards, an alert. With it, the container cycles and the surface reading stays green. Checking docker logs for WAL replay messages on startup is a cheap habit, since a Prometheus that replays its WAL more than once a day is telling you something.
Series count is what moves the memory number. Worker metrics with per-URL or per-user labels grow it in a way that scrape volume never does, and each series costs RAM in the head block continuously rather than per request.
The one that changed how I prioritize things: losing Prometheus is worse than losing any single service it watches. Every incident after that point gets diagnosed blind, which is why I would now cut Grafana, Loki, or Tempo before cutting Prometheus if the host is short on memory.
When this applies, and when it does not
This sizing logic fits any Docker Compose or Kubernetes deployment of upstream Prometheus. It matters most on home-lab and NAS stacks following the LGTM pattern, since those are the ones where memory is tight enough that someone is tempted to trim it.
It does not transfer cleanly to VictoriaMetrics or Mimir, which have different storage engines and different memory profiles. Thanos and Cortex federated setups are their own conversation, since the per-shard profile changes. And Prometheus in agent mode or a remote-write-only configuration keeps no local head block at all, so the whole question goes away.
Practical takeaway
Prometheus is the one service in an observability stack that is a database, and the head block it keeps in RAM is what your memory limit has to cover. Size it from the number of live series, not from what the container next to it in the Compose file happens to be using.
References
- Storage — Prometheus documentation — the current block is kept in memory and secured by a WAL, plus the semantics of
--storage.tsdb.retention.timeand--storage.tsdb.retention.sizeand the disk-sizing formula - Do not overuse labels — Instrumentation | Prometheus — every labelset is another time series with a RAM cost, and the suggested cardinality ceilings
- Resource constraints — Docker Docs — what
--memory(and therefore Compose’smem_limit) enforces, and the OOM behavior behind the kill - Start containers automatically — Docker Docs —
unless-stoppedsemantics and the ten-second rule that does not protect a container which starts successfully and then dies
Comments · github discussions
repo brandonwie/brandonwie.dev · category "Blog Comments" · term prometheus-tsdb-memory-sizing