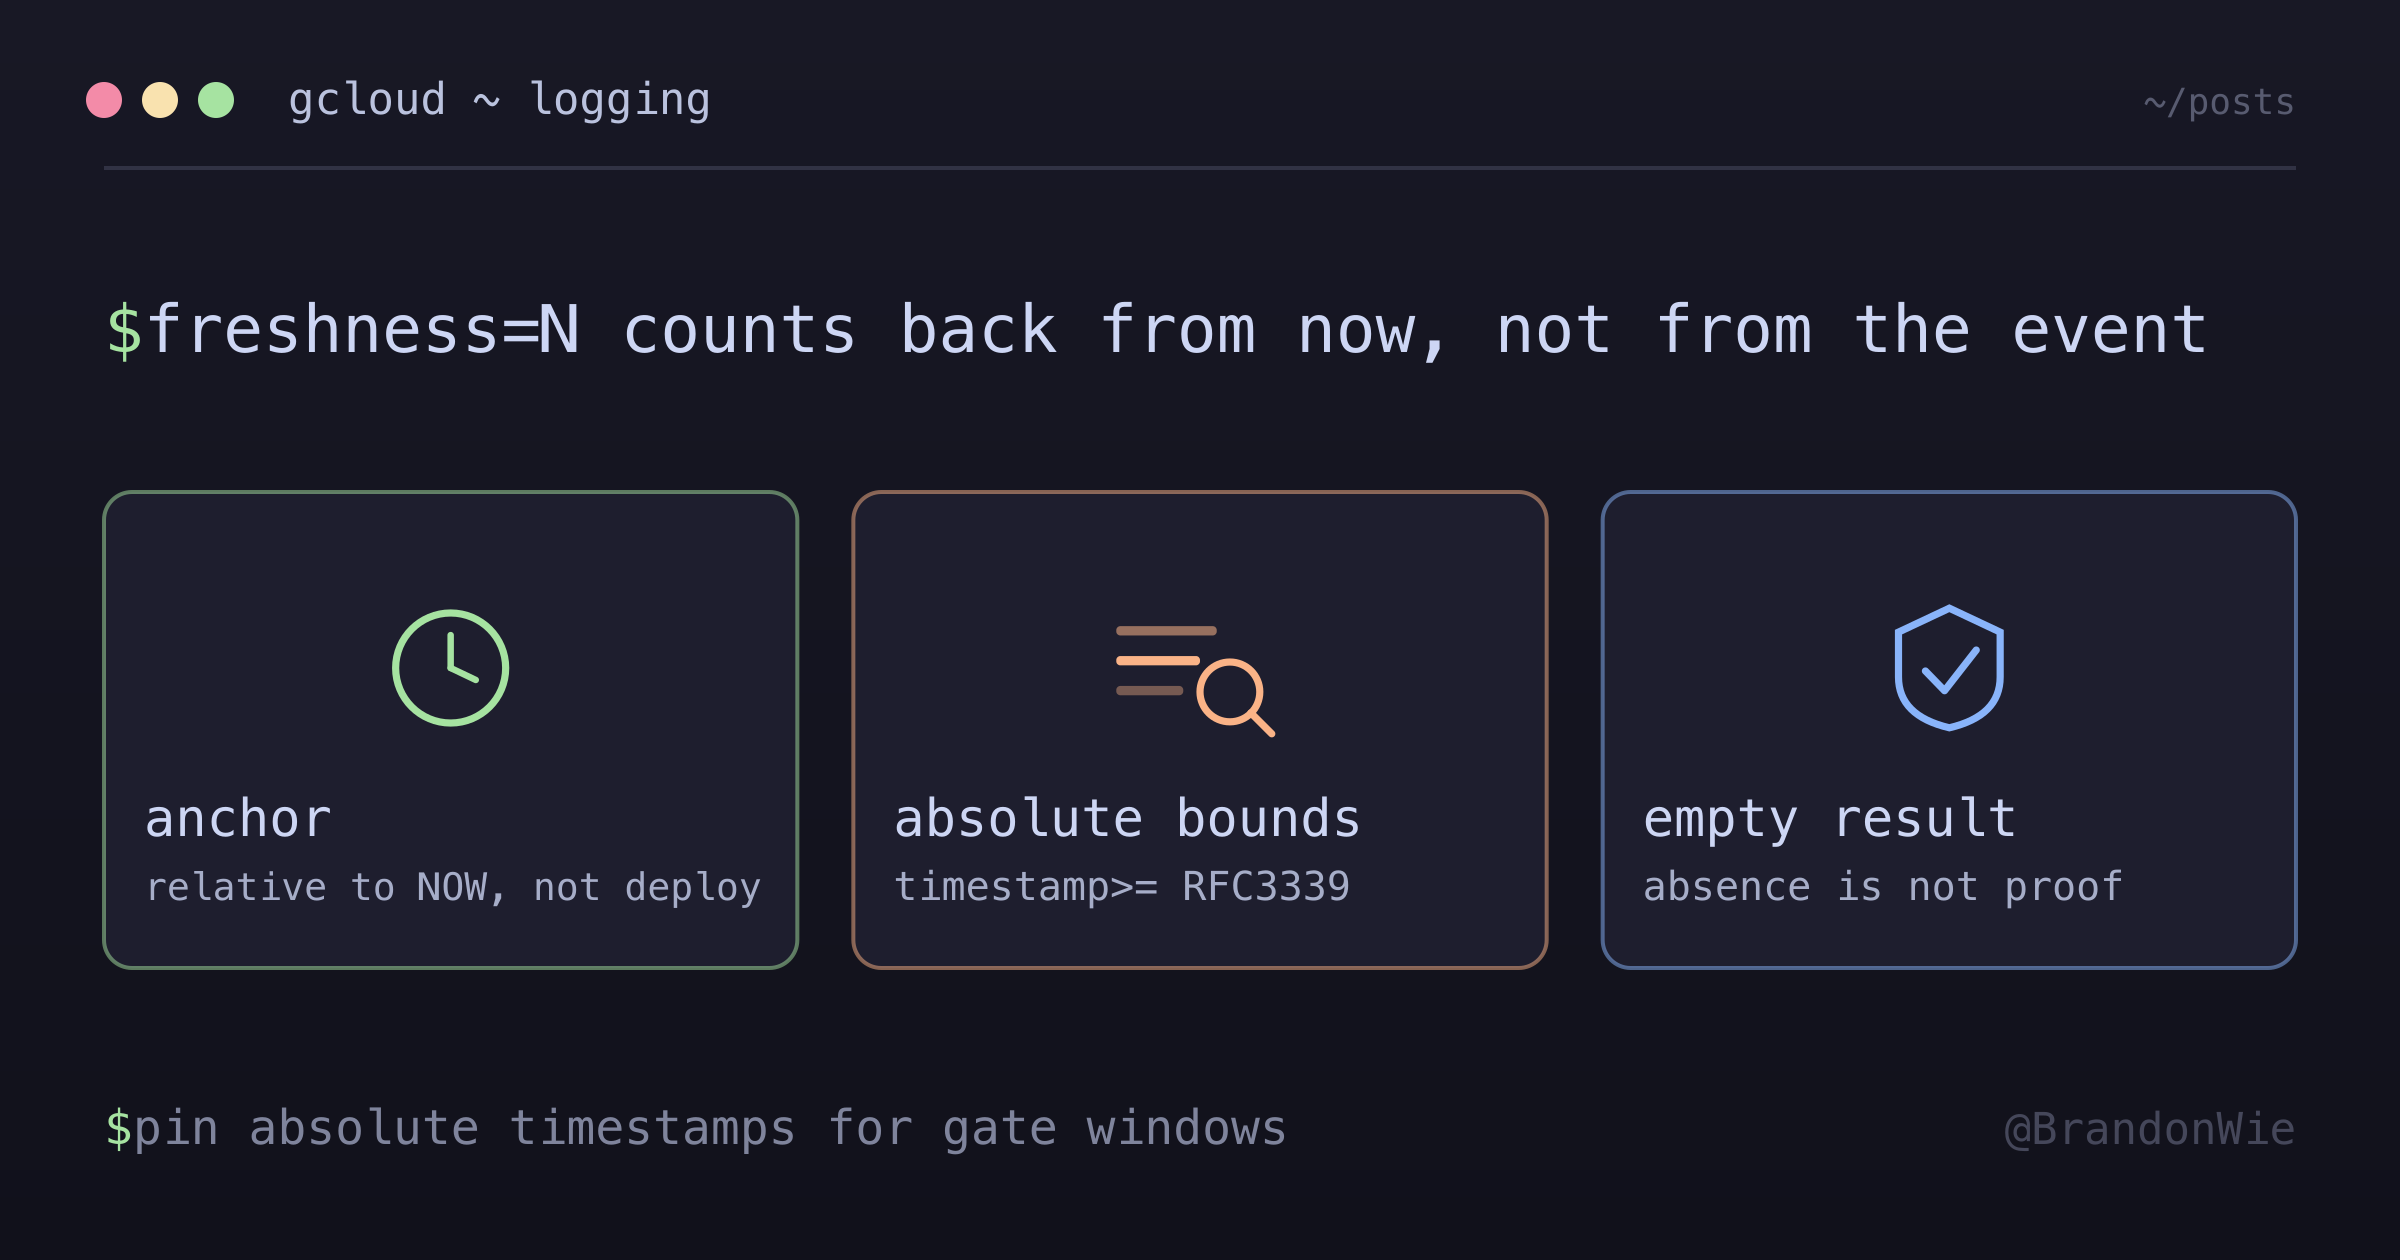
gcloud Logging `--freshness=N` is "N hours before NOW", not "since event"
`--freshness` measures backwards from the moment the command runs, not from the event you care about. A post-deploy verification gate queried a day later can silently skip the start of its own window — absolute `timestamp>=` / `timestamp<=` bounds are the fix.
On this page
- What --freshness actually measures
- Writing out the arithmetic
- Pinning both ends to the event
- Asking for less output
- Padding for late arrivals
- The question a tighter window still cannot answer
- Scripting the range without fighting date
- The same shape in other log CLIs
- When relative is fine
- What I would keep from this
- References
I had a 24-hour log-observation gate open on crucio, one of my own projects: ship a retry helper around a MinIO stat_object call, then watch production logs for a day before calling the fix good. When I came back to close the gate, I reached for gcloud logging read with --freshness=48h, on the reasoning that 48 was comfortably more than the 24 hours I needed to cover.
It came back clean. The window it actually searched started six hours after the gate opened.
Nothing in the output says so, which is the part I think is worth writing down. A log query that searches the wrong window does not look any different from one that searches the right window and finds nothing.
A gate query has this shape: an anchor string that the fix logs, scoped to one service and bounded by a freshness window.
gcloud logging read 'resource.labels.service_name=foo AND
  jsonPayload.message=~"my-anchor"' \
  --limit 500 --freshness=24h
I read that last flag as “logs since the gate opened 24 hours ago.” That is not what it means.
What --freshness actually measures
The official reference for gcloud logging read describes the flag in two sentences: “Return entries that are not older than this value. Works only with DESC ordering and filters without a timestamp.”
“Not older than” is the whole story. The value is a duration such as 30m or 24h, and gcloud subtracts it from the moment the command runs. The duration syntax comes from gcloud topic datetimes, where a bare 24h is an absolute duration, a period of time with no anchor of its own. There is no argument for telling the flag which event the window should hang off. It always hangs off now, so the window slides forward every time I re-run the same command.
Two details from that reference page compound the problem. The default is 1d, so a bare gcloud logging read 'some filter' with no freshness flag at all is quietly answering a question about the last day rather than about all of history. And the flag applies only when the filter carries no timestamp of its own, which changes how the two mechanisms relate. More on that below.
Writing out the arithmetic
Call the deploy T0, so the gate runs from T0 to T0+24h. Here is what different combinations actually cover:
| Query run at | Flag | Window searched | Result |
|---|---|---|---|
T0+30h | --freshness=24h | T0+6h → T0+30h | Misses the first 6 hours of the gate |
T0+30h | --freshness=48h | T0-18h → T0+30h | Covers the gate, plus 18 hours of pre-deploy logs |
T0+54h | --freshness=48h | T0+6h → T0+54h | Misses the first 6 hours again |
| any time | absolute range | T0 → T0+24h | Same window on every run |
When I first wrote this down for myself, I filed both failures under one heading, “the window is too small”, and the table is what showed me that was wrong. They are different failures with different symptoms.
A window that starts too late returns a clean result without ever having looked at the hours that mattered, which is the dangerous one, because clean is exactly what I was hoping to see. A window that starts too early is noisier but not harmless either: pre-fix errors turn up inside a query meant to demonstrate that the fix worked. The honest reading of that result is “inconclusive”, though in the moment it reads as “still broken.”
Either way the window is anchored to the wrong event. Widening the duration does not fix an anchoring problem; it just changes which end leaks.
Pinning both ends to the event
For anything retrospective, the version I now use puts both bounds in the filter itself:
gcloud logging read 'resource.labels.service_name=foo AND
  jsonPayload.message=~"my-anchor" AND
  timestamp>="2026-05-10T08:00:00Z" AND
  timestamp<="2026-05-11T10:00:00Z"' \
  --limit 500 \
  --format='value(timestamp,severity,jsonPayload.message)'
Those timestamps are RFC 3339, the internet timestamp profile of ISO 8601, where Z marks UTC. The Logging query language documentation describes a timestamp as a string in RFC 3339 or ISO 8601 format and shows the same timestamp >= "..." comparison, so both bounds can sit in the filter string joined by AND.
The property I actually wanted is that this query is idempotent over time. Run it tomorrow, next week, or six months from now and it returns the same window, because the window is described by the event rather than by the clock.
It is worth being precise about how this interacts with --freshness, since the docs say the flag works only with filters that have no timestamp. They are alternatives rather than layers you stack. Once the filter carries a timestamp constraint, --freshness is out of the picture. I did not test whether gcloud errors or silently drops the flag when both are present, so I stopped writing both.
Asking for less output
The --format='value(timestamp,severity,jsonPayload.message)' part is not cosmetic. The default output wraps each entry in a large envelope of resource labels, insert IDs and trace fields. For a gate decision I am reading three columns and scanning for a pattern. Terse tabular output is what makes 500 entries reviewable in a terminal instead of something I pipe to a file and give up on.
Padding for late arrivals
I close the window slightly past the nominal gate end rather than exactly on it, because ingestion is not instantaneous. Entries have landed tens of seconds after the event in my own runs. A minute or two of margin costs nothing and avoids the case where the last relevant entry falls just outside the upper bound.
I have not found a documented ingestion-latency guarantee to cite for that number, so I would treat it as cheap insurance rather than a measured constant. If your own pipeline has buffering in front of Cloud Logging, the margin you need is probably larger than mine.
The question a tighter window still cannot answer
Fixing the anchor makes the query trustworthy. It does not make an empty result meaningful, and this is the trap I would most want to flag.
Zero matching entries has at least two readings: the bug is fixed and no error surfaced, or the code path was never exercised because no traffic reached it during the window. A correctly anchored query rules out a third reading (that the entries existed but fell outside the search), and that is worth having. It does nothing about the first two.
The habit that helps is querying for baseline traffic on the affected path over the same window, before concluding anything from the absence of errors. If the path shows no activity at all, the gate has not observed anything yet and the clean result is empty in the uninteresting sense. That check is cheap and I have been glad of it more than once.
Scripting the range without fighting date
Generating the bounds in shell is where portability bites. date -u '+%Y-%m-%dT%H:%M:%SZ' behaves the same on macOS and Linux, but date -d '24 hours ago' does not. The BSD date shipped with macOS reads -d as a daylight-saving flag rather than GNU’s date-string parser. A gate script that works on a Linux runner and fails on a laptop is an annoying thing to debug at the moment you want an answer.
Python’s datetime sidesteps the difference:
START=$(python3 -c "from datetime import datetime, timezone, timedelta;
print(datetime(2026, 5, 10, 8, 0, tzinfo=timezone.utc).isoformat().replace('+00:00','Z'))")
END=$(python3 -c "from datetime import datetime, timezone;
print(datetime(2026, 5, 11, 10, 0, tzinfo=timezone.utc).isoformat().replace('+00:00','Z'))")

gcloud logging read "resource.labels.service_name=crucio-api AND
  jsonPayload.message=~\"#154 mitigation\" AND
  timestamp>=\"$START\" AND
  timestamp<=\"$END\"" \
  --limit 500 \
  --format='value(timestamp,severity,jsonPayload.message)'
The .replace('+00:00','Z') is there because isoformat() emits the offset form and the Z form reads better in a filter string; both are valid RFC 3339. Note the switch to double quotes around the filter so the shell expands $START and $END, which means the inner regex quotes need escaping.
The same shape in other log CLIs
This is not a gcloud quirk so much as a default that most log CLIs share, since “the last N minutes” is the common case:
| Tool | Relative (anchored to now) | Absolute (anchored to the event) |
|---|---|---|
gcloud logging read | --freshness=24h | timestamp>="..." / timestamp<="..." in the filter |
aws logs filter-log-events | none | --start-time / --end-time, epoch milliseconds |
kubectl logs | --since=1h | --since-time=2024-08-30T06:00:00Z |
The AWS CLI reference defines --start-time as the start of the range expressed as milliseconds after Jan 1, 1970 UTC, which is absolute by construction. Converting a wall-clock time into epoch milliseconds is the only friction. kubectl logs offers both forms, and the difference between --since and --since-time is exactly the difference described here.
When relative is fine
I do not want to overstate this. Relative windows are the right default for the case they were built for, and I still reach for --freshness=5m constantly.
Watching a live incident is genuinely a “what is happening right now” question, and anchoring it to a fixed timestamp would mean editing the command every few minutes. The same goes for a sanity check immediately after a deploy. Within the first few minutes, “now minus a bit” and “since the deploy” are close enough to the same window that the distinction does not matter.
The distinction starts mattering the moment the answer is meant to be a decision about the past: closing a verification gate, reproducing a known incident window weeks later, or auditing whether a log line ever appeared since a fix shipped. Those queries get re-run, often by someone who was not there the first time, and a relative window means each run answers a slightly different question.
What I would keep from this
The rule I ended up with is short. If the question is about a specific past window, describe that window in the filter. Relative windows are for questions about right now.
The failure mode is worth internalizing separately from the flag, because it survives changing tools. A query anchored to the wrong event does not fail loudly. It returns a plausible-looking result to a question nobody asked. That is a harder thing to catch than a syntax error, and the only defense I have found is writing the window arithmetic out once, the way the table above does, instead of trusting that a bigger number covers more ground.
Comments · github discussions
repo brandonwie/brandonwie.dev · category "Blog Comments" · term gcloud-logging-freshness-flag-semantics